SPATIAL ANALYSIS OF THE DISTRIBUTION, DENSITY, AND HABITAT SUITABILITY OF APHIDS ON CABBAGE IN GHANA, USING REMOTE SENSING DATA AND MACHINE LEARNING
This analysis was performed to support Dr. Ethelyn Echep who is an entomologist and wanted to understand the habitat suitability of two insects (Lipaphis erysimi pseudobrassicae and Myzus persicae) in Ghana as part of her PhD project. She visited 91 cabbage farms in Ghana to collect occurrence data on the two insects, which was used for the analysis.
- Completed: August 2021
- Context: PhD Research support for Dr. Ethelyn Echep
- Tools: ArcMap, R Programming
Webinar Presentation
Presented during the Remote Sensing Day 2021, organized by Where Geospatial
EXPLORATORY DATA ANALYSIS - STUDY AREA
The study area is Ghana. As shown in the map, the red dots are the places where insect occurrence data were collected.
Questions driving the analysis
- What is the spatial pattern of the insect distribution?
- If there is a spatial pattern, what could be the underlying contributing factors?
- Where are the suitable habitat locations considering the contributing factors?

EXPLORATORY DATA ANALYSIS - ADDRESSING QUESTION 1
What is the spatial pattern of the L.E.P insect distribution?
Using the Average Nearest Neighbor analysis in ArcMap, it was found that the spatial distribution was clustered for L.E.P.

EXPLORATORY DATA ANALYSIS - ADDRESSING QUESTION 1
What is the spatial pattern of the M.Persicae insect distribution?
Using the Average Nearest Neighbor analysis in ArcMap, it was found that the spatial distribution was clustered for M.Persicae.

EXPLORATORY DATA ANALYSIS - ADDRESSING QUESTION 2
If there is a spatial pattern, what could be the underlying contributing factors?
To determine the contributing factors, the table shows 19 Bioclimatic variables and 2 Remote Sensing variables that were used as covariates in a supervised machine learning modelling with the species occurrences as the dependent variable.

EXPLORATORY DATA ANALYSIS - ADDRESSING QUESTION 2
If there is a spatial pattern, what could be the underlying contributing factors?
Visualization of the covariates in R Programming

ANALYSIS - ADDRESSING QUESTION 2
If there is a spatial pattern, what could be the underlying contributing factors?
A Random Forest model was fit for the L.E.P insect data in R Programming using the covariates listed above as predictors and the occurrences as the dependent variable. The accuracy of the model for a 10-fold cross-validation was 66.57%, and the variable importance is shown in the chart.

ANALYSIS - ADDRESSING QUESTION 2
If there is a spatial pattern, what could be the underlying contributing factors?
A Random Forest model was fit for the M.Persicae insect data in R Programming using the covariates listed above as predictors and the occurrences as the dependent variable. The accuracy of the model for a 10-fold cross-validation was 59.79%, and the variable importance is shown in the chart.

ANALYSIS - ADDRESSING QUESTION 2
If there is a spatial pattern, what could be the underlying contributing factors?
The top 6 contributing factors addressing question 2 are:
- L.E.P contributing factors (BIO1, BIO3, BIO16, BIO19, LAI and NDVI)
- M. persicae contributing factors (BIO3, BIO7, BIO12, BIO19, LAI and NDVI)
- Common contributing factors (BIO3, BIO19, LAI and NDVI)
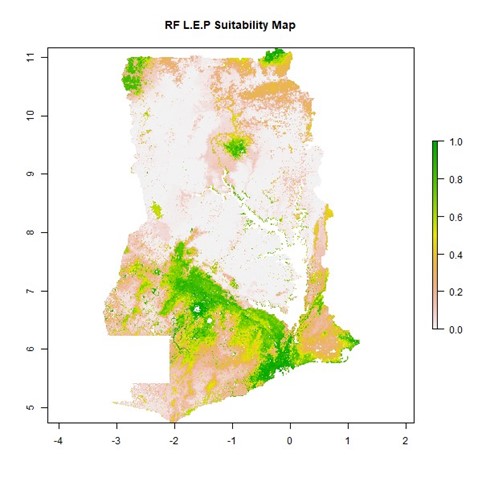
ANALYSIS - ADDRESSING QUESTION 3
Where are the suitable habitat locations considering the contributing factors?
To address question 3, the modelled random forest was used to make predictions at grid locations created over Ghana for the L.E.P insect.

ANALYSIS - ADDRESSING QUESTION 3
Where are the suitable habitat locations considering the contributing factors?
To address question 3, the modelled random forest was used to make predictions at grid locations created over Ghana for the M.Persicae insect.
