SITE SELECTION ANALYSIS FOR FERTILIZER EXPERIMENT
This analysis was performed within a timeframe of 5 days which was a crucial step to serve as decision support for selecting sites for fertilizer field trials. The task was to produce a map showing all possible combinations of different data layers in order to select field trial sites that capture the maximum overall variability. Data layers used are Soil Organic Matter, Soil Depth, Soil pH and Slope.
- Completed: December 2021
- Context: IFDC-Fertilizer Research and Responsible Implementation
- Tools: R Programming
CLASSIFICATION OF LAYERS
Classification ranges were defined for each data layer based on their histogram to bring them to the same scale. The class definitions are shown in the table.

VISUALIZATION OF CLASSIFIED LAYERS
The image shows the classified layers

VISUALIZATION OF 54 COMBINATIONS AS A CONTINUOUS MAP
All possible combinations were assigned a unique ID and mapped as a continuous map with forest reserved areas masked out.

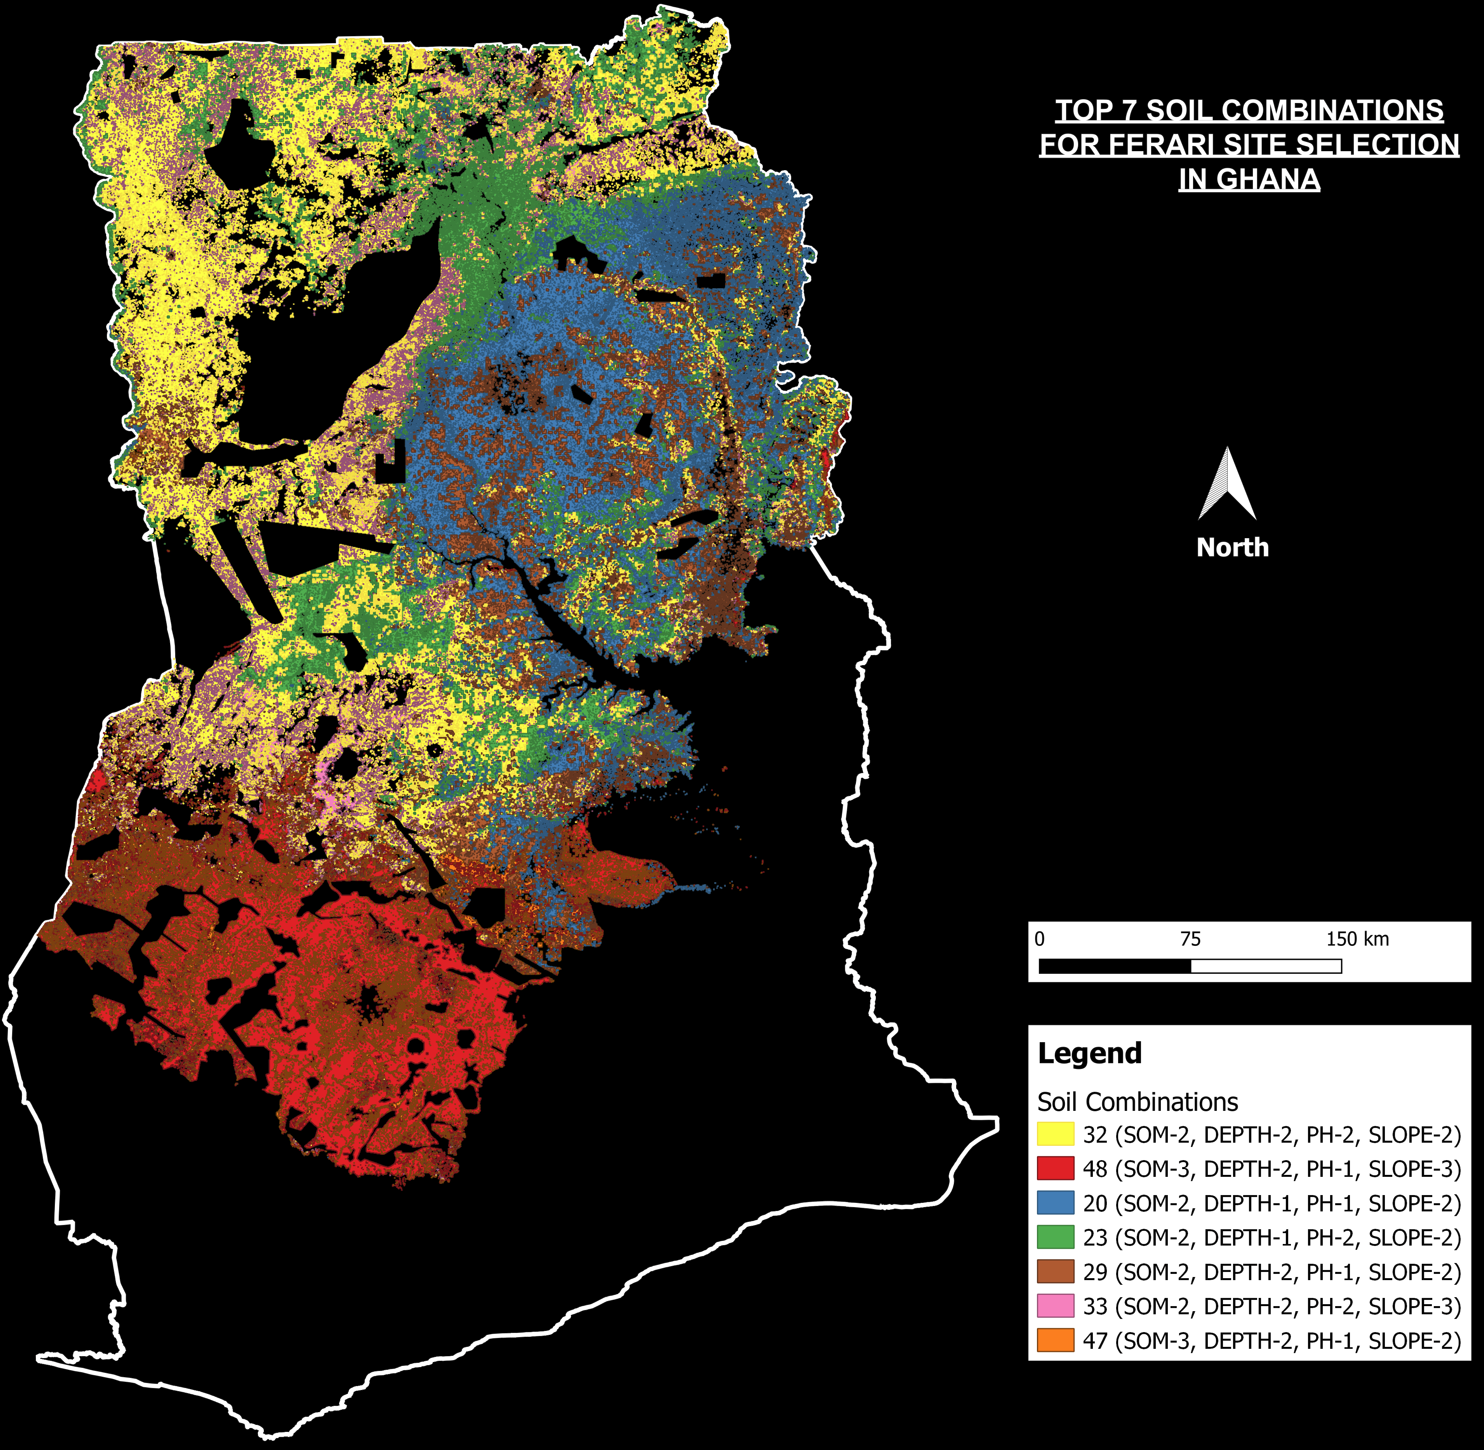
CATEGORICAL MAP OF SELECTED 7 COMBINATIONS
The continuous nature of the 54 combinations map made it difficult to precisely determine class combinations. Therefore, the top 7 class combinations were selected and mapped. This map assisted the team to make informed decisions by proposing sites for fertilizer trials based on the variability of driving factors.
