ESTIMATION OF MAIZE YIELD GAPS IN GHANA USING CROP MODELLING AND SPATIAL ANALYSIS
The purpose of this study was to simulate the potential yields of maize under optimal growth conditions across Ghana using simulation modeling based on plant physiological processes as affected by weather and crop characteristics, and to determine the potential yield gap with observed yields reported by farmers, as well as the factors that influence that gap. A total of 676 observed data points were used to validate a calibrated a Light Interception and Utilization (LINTUL-1) crop model. The validated model was used to simulate the potential yields at 2374 randomly sampled points from existing cropland locations to create a spatial overview of the yield levels through mapping techniques.
- Completed: July 2022
- Context: IFDC-Fertilizer Research and Responsible Implementation
- Tools: R Programming
QUESTIONS AND OBJECTIVES
This analysis was driven by the following questions and objectives:
Questions
- How does weather influence maize yields in Ghana?
- How do maize yield gaps vary spatially in Ghana?
- How do weather and soil factors influence the maize yield gaps in Ghana?
.
Objectives
- To simulate the potential maize yields in Ghana using weather variables
- To estimate potential maize yield gaps in Ghana
- To determine the weather and soil variables that significantly influence the maize yield gaps in Ghana
CONCEPTUAL FRAMEWORK
The image shows the various steps in the analysis process

STUDY AREA
The Study Area is Ghana. The map below shows maize field observations obtained from peer-review papers in green dots, 10 random sample points per district based on land cover in red dots (the landcover layer MODIS MCD12Q1 helped to sample from crop lands), district boundaries, and agroecological zones in Ghana.

LINTUL MODEL CALIBRATION (OBJECTIVE 1)
The LINTUL model for maize was initially calibrated based on existing research findings and expert knowledge. The parameters are as shown in the image.

ESTIMATION OF POTENTIAL MAIZE YIELDS USING ORDINARY KRIGING
The calibrated model was used to simulate the potential maize yields at all the random sampled point locations (2374 points), and mapped using Ordinary Kriging geostatistical method as shown in the image.

POTENTIAL MAIZE YIELD DISTRIBUTION IN GHANA
The Ordinary Kriging results was further plotted to visualize the distribution by agroecological zones as shown in the figure below. Guinea savanna has the highest potential whilst Moist evergreen has the lowest.

YIELD GAPS AND GEOSTATISTICAL MAPPING (OBJECTIVE 2)
GEOCODING OF OBSERVED MAIZE YIELD DATA
Data on observed maize yield and production for year 2017 was downloaded from the Ghana open data website. This data was geocoded because it had no coordinates assigned. As there were fewer districts than the shapefile used to perform geocoding, the results had some empty districts shown in the figure below. Yield gaps were calculated based on the observed data.

YIELD GAPS AND GEOSTATISTICAL MAPPING (OBJECTIVE 2)
CALCULATING POTENTIAL YIELD GAPS PER DISTRICT
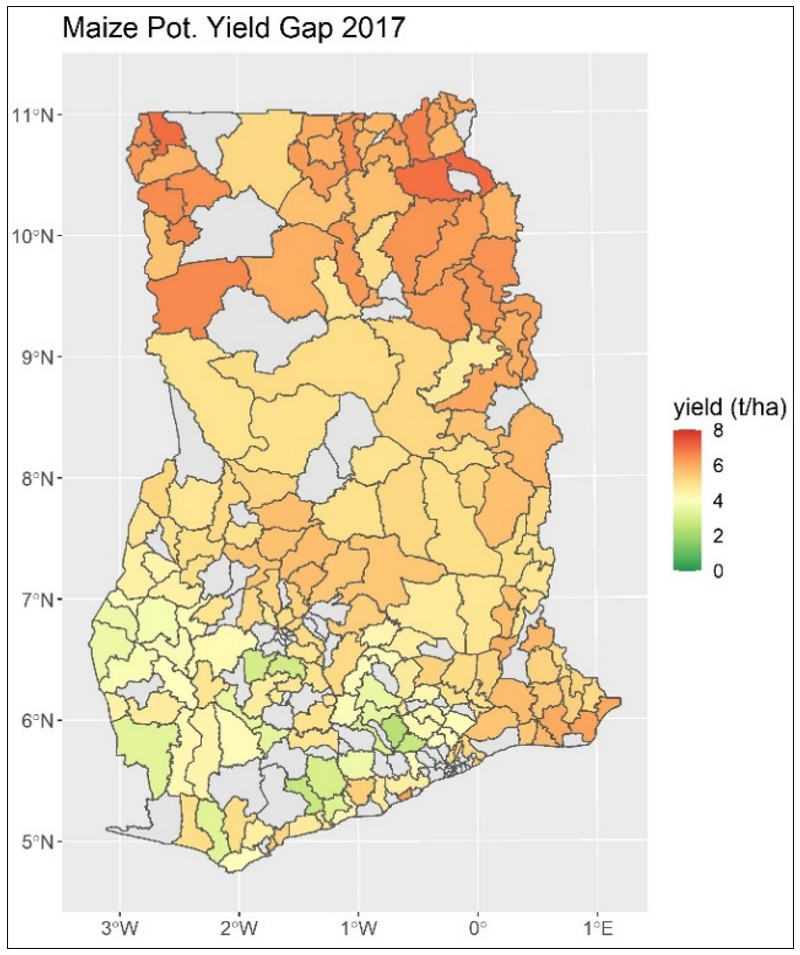
The formula for calculating potential yield gap is: Potential Yield Gap = Avg. Pot. Yield Per District - Obs. Yield Per District. The yield gap was calculated for each district and mapped as shown in the maps below. The first map from the left is the Observed Yields, the map in the middle is the Potential Yield, and the third map on the far right is the Potential Yield Gap. It can be seen that there are higher gaps (6-8 t/ha) in the northern part of Ghana than the south.

YIELD GAPS AND GEOSTATISTICAL MAPPING (OBJECTIVE 2)
A GEOSTATISTICAL MAP OF THE MAIZE YIELD GAPS
To visualize the yield gaps for the districts that have empty data, Ordinary Kriging geostatistical method was used to predict and visualize the yield gaps covering the entire country. The statistical results show that there is a spatial autocorrelation range of 117,172m, a nugget (variation at very small distances) of 0.22, and a sill (maximum variation) of 0.37. The wide range implies that the potential yield gap values are similar in a very large geographical area which is evident in the smoothness of the output map shown

YIELD GAPS AND GEOSTATISTICAL MAPPING (OBJECTIVE 2)
CALCULATING MAIZE POTENTIAL PRODUCTION IN GHANA
Based on the potential yield per district, the potential production per district was calculated. The formula for calculating potential production per district is: Potential Production Per District = Harvested Area per District (Ha) * Avg. Pot. Yield Per District (T/Ha)

SIGNIFICANT FACTORS THAT INFLUENCE MAIZE YIELD GAPS (OBJECTIVE 3)
To understand the driving factors for the potential maize yield gaps, Random Forest machine learning model was used to explain the variability (68%) of the potential yield gaps and to determine the important variables which were used in a regression model to estimate their effects on the yield gaps. The figure below shows the formula used and the variable importance plot of the Random Forest model. The selected variables used in regression modelling contributes to 79.1% of the explained variability.

SIGNIFICANT FACTORS THAT INFLUENCE MAIZE YIELD GAPS (OBJECTIVE 3)
REGRESSION ANALYSIS RESULTS
The figure below shows the regression analysis results. The red arrows indicate variables that have a positive influence on the yield gaps whilst the green arrows show variables that have a negative influence on the yield gaps. Based on the results, it could be estimated that a 1 unit increase in Organic Nitrogen may reduce the potential yield gaps by about 1.4 t/ha.

CONCLUSION
- The potential yields in Ghana are within a range of about 5.56 to 8.61 t/ha with a mean of about 6.98 t/ha. Guinea Savanna has the highest maize potential yield.
- Potential yield gaps in the country range from 3.0 to 6.5 t/ha with a mean of about 5.0 t/ha and also has a very low spatial variability.
- The nationwide maize production gap stands at about 4.86 Mtons.
- Organic Nitrogen (Est. -1.39) and Root Zone Depth Water Holding Capacity (Est. 0.39) are amongst the factors that significantly influence the Potential maize Yield Gap